Entomology and
Applied Science Letters
Applied Science Letters
 2026
Volume 13
Issue 2
2026
Volume 13
Issue 2

Honey-bee colonies are increasingly monitored through microphones, vibration sensors, temperature probes, scales, cameras, radar, and environmental instruments, yet these measurements do not automatically constitute a biologically valid colony phenotype. The scientific and decision problem is therefore not simply how to collect more data, but how to relate heterogeneous signals to colony organization, resilience, stress, and management without collapsing observation, inference, diagnosis, and intervention into a single step. This article develops an original, explicitly non-validated digital-phenotyping architecture for treating the colony as a computable biological system. The approach integrates acoustic and behavioural signals; thermal, weight, and environmental data; nutritional conditions; parasites, pathogens, and microbiota; multimodal fusion; uncertainty representation; biological validation; and management interpretation. The strongest defensible synthesis is that no individual modality can identify colony state reliably across contexts, whereas temporally aligned and biologically contextualized modalities may support better state interpretation when their distinct meanings, confounders, and scales are preserved. The proposed architecture therefore separates signal acquisition from modality-specific processing, contextual modelling, conditional fusion, colony-state inference, causal adjudication, and management action. Its principal limitations arise from heterogeneous sensors, incomplete ground truth, seasonally shifting baselines, colony-to-colony variation, sparse biological sampling, and limited external validation. Sensor agreement is consequently treated as convergence of observations rather than proof of biological validity, and early warning is treated as a prompt for inspection rather than evidence that intervention will be beneficial. Progress requires longitudinal multimodal datasets linked to standardized colony examinations, explicit uncertainty, transfer testing, transparent decision rules, and governance arrangements that preserve beekeeper judgement and biological accountability.
INTRODUCTION
A honey-bee colony is a dynamic biological collective in which thousands of individuals regulate brood care, food acquisition, thermoregulation, defence, sanitation, and reproduction through distributed interactions. Colony health therefore cannot be reduced to the condition of an average worker or to a single disease measurement. Nutrition and disease can form reciprocal feedbacks: poor nutritional conditions may constrain immune and physiological function, while disease can alter resource use, behaviour, and colony performance [1]. This reciprocal organization makes the colony scientifically observable but interpretively difficult. A computable colony must be represented as a changing superorganism whose state emerges from interactions among individuals, stored resources, brood, nest microclimate, pathogens, parasites, microbial communities, and external conditions.
The decision relevance of this problem is especially clear for Varroa destructor. Varroa is not merely an external countable stressor; it is a biologically complex parasite linked to viral transmission, host damage, and colony decline, with effects conditioned by infestation level, season, host population, and management history [2]. A sensor may detect altered sound, heat production, entrance activity, or weight trajectory in an infested colony, but none of those changes uniquely identifies Varroa as the cause. Similar outward disturbances can arise from queen events, forage scarcity, heat stress, brood-cycle transitions, pesticide exposure, or beekeeper manipulation. Digital phenotyping must therefore preserve the difference between a signal associated with disturbance and an identified colony state.
Interactions among pesticides, viruses, nutrition, and host condition further complicate interpretation because combined exposures can generate effects that cannot be attributed to one observable channel alone [3]. Long-term field assessment also indicates that pesticide exposure may coincide with changes in colony strength and microbial composition, but such associations remain dependent on exposure patterns, season, landscape, and measurement design [4]. These findings support multimodal observation while simultaneously warning against mechanistic overreach. Multiple sensors can agree because they respond to the same external context, shared technical artefact, or compensatory colony response; agreement does not establish that the inferred biological explanation is correct.
This article proposes an evidence-grounded but explicitly non-validated architecture for multimodal digital phenotyping of honey-bee colonies. Its aim is to define the components, information relations, decision points, boundary conditions, failure modes, and validation requirements needed to move from heterogeneous colony observations toward cautious colony-state interpretation. The central argument is that acoustic, behavioural, thermal, weight, environmental, nutritional, parasitological, pathological, and microbial information should remain distinct through acquisition and modality-specific interpretation, then be conditionally integrated with temporal and biological context. The architecture does not treat state inference as causal diagnosis, nor early detection as proof that a management intervention will improve colony outcomes.
The honey bee colony as a computable biological system
Treating the colony as a computable biological system requires a defined relationship among biological processes, observable signals, measurement devices, contextual variables, and decision outputs. Sensor-based monitoring frameworks have distinguished operational monitoring from investigative and predictive uses, thereby showing that the same measurement can serve different purposes depending on how it is interpreted [5]. In the proposed synthesis, the colony is not converted into one composite score. It is represented through parallel observational channels linked to specific constructs: sound and vibration for collective activity patterns; cameras or radar for movement; temperature for local thermal conditions and regulatory performance; weight for integrated mass change; and environmental measurements for the context in which internal signals arise. The intended output is a conditional description of colony state with uncertainty, not a definitive diagnostic label.
Existing systems establish that technically different signals can be collected continuously within or around a hive. Smart-hive platforms have combined temperature, humidity, weight, and acoustic measurements in a single monitoring arrangement [6]. Nondisruptive monitoring that integrates scales and cameras has also shown that within-day hive-weight change can be examined alongside entrance traffic, making it possible to compare mass dynamics with visible movement rather than interpreting either alone [7]. These systems provide an evidence basis for synchronized measurement, but their outputs remain proxies. Weight is influenced by nectar, water, bee movement, stored food, equipment changes, and beekeeper actions, while traffic is shaped by weather, flowering, orientation flights, colony population, and disturbance. Computability therefore depends as much on contextual metadata and construct definition as on sensor density.
The proposed system also accommodates measurement channels that reduce hive disturbance or capture information unavailable to conventional probes. Non-invasive radar has been investigated as a means of monitoring colony activity through hive structures [8]. A recent multimodal phenotyping dataset further links hive acoustics and environmental measurements with periodic colony inspections, illustrating the importance of connecting continuous signals to biological observations collected at slower intervals [9]. These advances support a layered architecture in which raw measurements undergo quality control, temporal alignment, modality-specific feature extraction, contextual annotation, and uncertainty-aware interpretation before any fusion occurs. Failure can arise from sensor drift, missing data, inconsistent placement, changing hive materials, colony-specific baselines, unrecorded management events, or weak biological labels. The proposed components, evidence bases, boundary conditions, failure modes, and validation requirements are organized in Table 1.
Table 1. The Honey Bee Colony as a Computable Biological System: Components, Evidence Basis, Relations, Boundary Conditions, Failure Modes, and Validation Requirements
|
Proposed component |
Purpose |
Evidence basis |
Relation or mechanism |
Input or precondition |
Expected output |
Boundary condition or failure mode |
Validation requirement |
|
Colony-level construct layer |
Define the biological object being interpreted |
Sensor-monitoring frameworks distinguish monitoring purposes |
Maps measurements to colony-level constructs rather than devices alone |
Explicit construct definitions and intended use |
Conditional colony description |
Device output is mistaken for phenotype |
Independent biological examination and construct-validity testing |
|
Multisensor acquisition layer |
Capture complementary colony and environmental observations |
Integrated smart-hive monitoring |
Collects parallel acoustic, thermal, humidity, and weight streams |
Calibrated devices, documented placement, and synchronized clocks |
Time-stamped modality-specific data |
Drift, missingness, and cross-sensor timing errors |
Calibration records, redundancy checks, and missing-data audit |
|
Weight–traffic relation layer |
Compare mass dynamics with external activity |
Joint scale and camera monitoring |
Relates hive-weight change to observed entrance traffic |
Stable scale, interpretable field of view, and weather metadata |
Contextualized mass and movement trajectories |
Nectar inflow, rain, manipulation, or traffic occlusion confounds interpretation |
Inspection logs and independent activity checks |
|
Non-invasive activity layer |
Observe movement without opening the hive |
Radar-based colony monitoring |
Detects activity-related motion through hive materials |
Suitable hive geometry and signal penetration |
Activity proxy |
Material effects, environmental noise, and uncertain biological specificity |
Comparison with video, inspection, and repeated colonies |
|
Multimodal phenotyping dataset layer |
Link continuous sensing with periodic biology |
Acoustics, environment, and inspection-linked data |
Aligns high-frequency signals with lower-frequency colony observations |
Shared identifiers, timestamps, metadata, and an inspection protocol |
Analysis-ready longitudinal records |
Sparse labels, class imbalance, and site-specific baselines |
External datasets and standardized colony-state labels |
|
Contextualization layer |
Prevent biologically ambiguous signals from being interpreted in isolation |
Weather, inspection, and hive metadata are required across monitoring systems |
Conditions each signal on season, environment, colony history, and management |
Complete contextual metadata |
Interpretable signal deviations |
Unrecorded beekeeper actions or local floral changes |
Prospective event logging and sensitivity analysis |
|
Conditional fusion layer |
Integrate evidence without erasing modality meaning |
Complementary signals can be synchronized in multisensor systems |
Combines only context-compatible features after modality-specific processing |
Quality-controlled and temporally aligned streams |
Uncertainty-qualified state hypothesis |
Correlated artefacts are treated as biological confirmation |
Ablation tests, transfer testing, and biological adjudication |
|
Human decision interface |
Convert interpretation into inspection or monitoring priorities |
Operational monitoring is distinct from prediction and diagnosis |
Presents evidence, uncertainty, and alternative explanations |
Defined user role and action pathway |
Inspection prompt or ranked hypothesis |
Alert is treated as an automatic treatment instruction |
Usability testing, decision audit, and outcome follow-up |
Acoustic and behavioural signals
Acoustic and vibrational signals arise from wing movement, locomotion, ventilation, communication, brood-related activity, and collective responses to changing colony conditions. Vibrational spectra have been used to investigate changes preceding swarming, supporting the possibility that temporally structured mechanical signals can provide advance information about a specific colony transition [10]. Acoustic and vibration monitoring has also been examined for beekeeping-relevant states such as queen presence and swarming [11]. These findings justify treating sound and vibration as biologically informative modalities, but not as universal labels. Spectral patterns depend on sensor position, comb coupling, colony size, hive material, ambient noise, season, and the behavioural pathway generating the signal. A pattern associated with swarming in one setting may not retain the same meaning in another.
Machine-learning analysis can classify recorded colony sounds, but the biological validity of the resulting classes depends on how labels were defined and independently confirmed. An edge-computing audio system has been developed to identify multiple colony anomalies, demonstrating the technical feasibility of local acoustic classification and near-real-time processing [12]. Yet a predicted anomaly remains a model output. It may indicate that the signal differs from a learned reference, not that a named biological cause has been established. False separation can result when environmental noise correlates with class labels, while false convergence can occur when different stressors produce similar changes in activity. Validation must therefore examine performance across apiaries, seasons, devices, colony strengths, and unanticipated states rather than only within the training environment.
Behavioural observation can provide a complementary channel because it measures movement more directly than acoustic inference. Deep-learning and Kalman-filter methods have been applied to track individual honey bees in the hive environment, creating opportunities to quantify movement trajectories and local interactions [13]. Radar-based bee counting, however, illustrates the practical difficulty of translating movement sensing into reliable colony-level counts under real-time conditions [14]. Occlusion, overlapping individuals, variable flight paths, clutter, and instrument geometry can all distort behavioural estimates. The analytical value of behavioural data therefore lies in convergence with other evidence and in clearly defined constructs, such as entrance traffic or within-hive movement, rather than in an assumption that more precise tracking automatically yields a complete colony phenotype.
Thermal, weight, and environmental data
Nest temperature is biologically meaningful because brood development and colony functioning depend on collective thermoregulation, but a temperature trace represents a local physical condition rather than health itself. Research relating temperature sensing to colony strength supports the use of thermal patterns as indicators of colony organization and population-related capacity [15]. Colony weight similarly offers an integrated measure of mass dynamics, and recent synthesis has emphasized its value for continuous monitoring while also identifying the need for improved interpretation and next-generation measurement strategies [16]. Thermal and weight signals are therefore complementary: temperature can indicate regulatory stability or disruption, whereas weight can reveal gains, losses, and daily cycles. Neither uniquely identifies the process responsible for change.
Environmental exposure can alter both the colony and the signals used to interpret it. Sublethal methoxyfenozide exposure has been associated with disrupted colony activity and thermoregulation, showing that chemical stress can influence multiple observable channels [17]. Simulated heat waves have also elicited colony-level adaptive responses with consequences at the individual level [18]. These findings illustrate two different interpretive problems. First, similar thermal deviations may arise from toxicological stress, extreme weather, colony demography, brood distribution, or sensor placement. Second, a colony may temporarily buffer disturbance, so a stable internal temperature does not necessarily demonstrate absence of stress. Thermal resilience must consequently be evaluated through trajectories, compensatory costs, recovery, and supporting biological observations.
Water dynamics provide a further example of why environmental context belongs inside, rather than outside, digital phenotyping. Monitoring under high temperatures has examined how water use and colony conditions interact during thermal challenge [19]. Weight change during such periods may reflect water collection and evaporation as well as nectar flow, food consumption, adult population, or beekeeper manipulation. The architecture therefore treats environmental data as conditioning information that changes the meaning of internal measurements. Weather, season, floral availability, local landscape, hive configuration, and management events should be aligned with thermal and weight records before anomaly detection or colony-state inference. Even when temperature, weight, and activity change together, their agreement supports a coordinated observational pattern, not a biologically validated diagnosis or a justified intervention.
Nutrition, parasites, pathogens, and microbiota
Nutrition is not simply an external resource variable; it shapes metabolic capacity, immune competence, brood production, worker longevity, and the colony’s ability to buffer disturbance. Experimental evidence indicates that the characteristic honey-bee gut microbiota can promote host weight gain through microbial metabolism and hormonal signalling [20]. Such findings justify including microbial function within colony phenotyping, but they do not establish a fixed “healthy microbiome” that can be diagnosed from one sample. Microbial composition varies with age, diet, season, geography, exposure, and sampling method, while individual-bee measurements may not represent colony-level function.
Perturbation studies further show that antibiotic exposure can disrupt gut microbial communities and increase worker mortality [21]. At colony scale, however, short-term pollen restriction and fungicide exposure may produce effects that colonies partly buffer, with responses differing across development, microbial composition, and observation period [22]. This contrast is central to digital phenotyping: a molecular or microbial disturbance may exist without an immediate sensor-visible colony decline, whereas an altered acoustic, thermal, or weight pattern may arise before its biological cause is identified. Absence of a rapid colony-level signal therefore does not prove biological safety, and presence of a signal does not specify whether nutrition, microbiota, toxic exposure, or another process is responsible.
Parasites and pathogens must likewise be represented through biologically distinct observations. Evidence linking viruses, vectors, and colony losses supports the inclusion of Varroa burden, viral detection, host response, and colony demography as related but non-interchangeable variables [23]. Detection of a virus does not establish active replication, pathological effect, or causal responsibility for decline; similarly, an infestation measure does not reveal the full host–vector–virus interaction. The architecture therefore places biological assays beside continuous sensor streams rather than treating them as labels automatically inferred from those streams. The evidence dimensions and interpretive boundaries for nutrition parasites pathogens and microbiota are summarized in Table 2.
Table 2. Nutrition, Parasites, Pathogens, and Microbiota: Colony-Level Pathways, Diagnostic Signals, Resilience Outcomes, Management Relevance, Validation Needs, and Interpretive Boundaries
|
Colony-health component |
Signal, stressor, or resource |
Biological pathway |
Indicator or evidence |
Colony-level implication |
Management relevance |
Uncertainty |
Interpretive boundary |
|
Nutrition |
Pollen and dietary quality |
Energy, protein, lipid, endocrine, and immune support |
Diet history, stores, brood pattern, foraging context |
Influences growth and buffering capacity |
Supports inspection of forage adequacy |
Resource quality and intake are incompletely observed |
Available forage is not equivalent to adequate nutrition |
|
Microbial function |
Core gut-community activity |
Metabolism and host signalling |
Microbial composition and functional evidence |
May influence worker condition and colony resilience |
Motivates microbiome-aware interpretation |
Individual samples may not represent the colony |
Microbial profile is not a standalone health diagnosis |
|
Microbial disruption |
Antibiotic or chemical perturbation |
Community disturbance and altered host function |
Dysbiosis-associated changes and mortality |
May reduce resilience or alter stress responses |
Supports cautious exposure history review |
Direction and persistence vary by context |
Association does not establish colony-level causation |
|
Colony buffering |
Pollen restriction and fungicide exposure |
Social and demographic compensation |
Developmental and microbiome responses over time |
Short-term stability may conceal biological cost |
Encourages longitudinal rather than one-time assessment |
Compensation may fail under prolonged or combined stress |
Stable sensors do not prove absence of harm |
|
Parasites |
Varroa infestation |
Feeding damage, vectoring, and host stress |
Mite burden, brood condition, population context |
Can contribute to declining colony function |
Supports targeted inspection and control assessment |
Effects vary with season and treatment history |
Mite detection alone does not quantify causal contribution |
|
Pathogens |
Viral presence and host response |
Infection, replication, tissue effects, and transmission |
Viral load, expression, pathology, and clinical context |
May contribute to weakening or loss |
Supports confirmatory biological testing |
Presence, replication, and disease are different constructs |
Detection is not equivalent to disease causation |
|
Combined stress |
Nutrition, chemicals, parasites, and pathogens |
Interacting physiological and social pathways |
Convergent but non-specific biological and sensor changes |
May exceed colony buffering capacity |
Prioritizes integrated inspection |
Interaction direction and magnitude are context-dependent |
Convergence is not proof of one mechanism |
Multimodal data fusion and colony-state inference
Multimodal fusion is useful only when each input retains a defined biological meaning. Combined analysis of in-hive sensors, weather records, and apiary inspections has demonstrated a practical route for forecasting colony-health status from heterogeneous information [24]. The important contribution is not that fusion produces an unquestionable label, but that continuous signals can be conditioned on environmental and inspection data. In the proposed architecture, acquisition, cleaning, calibration, and feature extraction remain modality-specific before temporal alignment and conditional integration.
Hive weight and environmental parameters have also been modelled together to assess colony dynamics [25]. Forecasting research using weight, internal temperature, and entrance traffic further shows that distinct time series can be analysed jointly while preserving their separate temporal behaviour [26]. Yet predictive agreement can arise from shared seasonality, weather dependence, or management events. Fusion must therefore include missing-data handling, baseline adaptation, uncertainty estimates, and tests showing whether each modality contributes information beyond common environmental structure.
Anomaly-detection systems extend this logic by identifying departures from learned patterns, including changes that may warrant inspection [27]. An anomaly, however, is not an identified colony state, and a state estimate is not a causal diagnosis. The architecture therefore produces ranked, uncertainty-qualified hypotheses such as altered thermoregulatory stability, unusual mass loss, or reduced activity, accompanied by alternative explanations and recommended confirmatory observations. Biological validity requires independent inspection, parasitological, pathological, nutritional, or microbial evidence rather than agreement among sensors alone.
Proposed digital-phenotyping architecture
The proposed architecture begins with a distributed acquisition layer containing calibrated acoustic, vibration, thermal, humidity, weight, visual, radar, atmospheric, and environmental channels. Self-powered smart-hive systems demonstrate that sensing, communication, and local control can be integrated under field constraints [28]. Wireless sensor platforms likewise support modular collection and transmission of hive measurements [29]. These technologies provide infrastructure rather than biological interpretation; power continuity, clock synchronization, sensor placement, drift, connectivity, and maintenance history must be recorded as part of the phenotype-generating process.
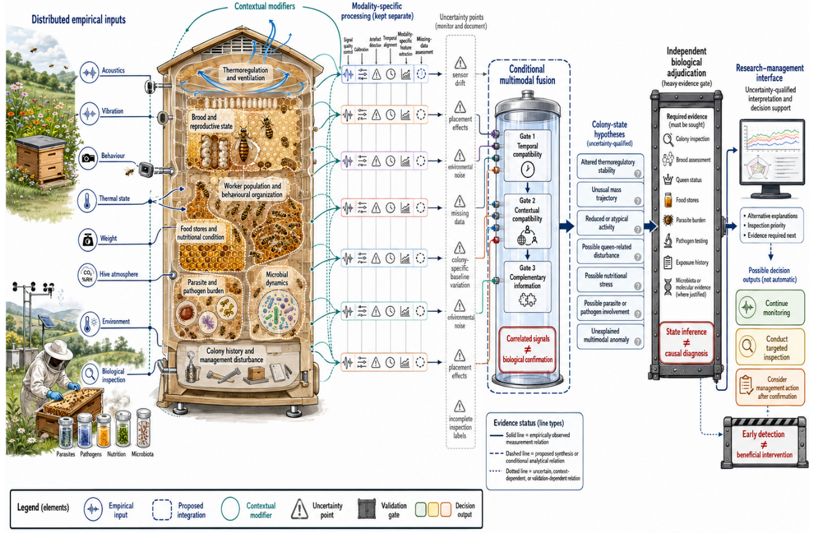
A second layer performs modality-specific quality control and feature construction before any fusion. Embedded contactless monitoring illustrates how activity-related information may be obtained without repeated hive opening [30]. Acoustic features, thermal stability, mass trajectories, entrance activity, weather, and inspection metadata should therefore enter separate processing paths, each with its own artefact checks and uncertainty. Contextual modifiers—season, colony strength, brood cycle, floral conditions, hive design, geography, and beekeeper actions—condition the meaning of every channel. Figure 1 shows the colony digital-phenotyping architecture within the analytical logic developed in this section.
|
|
|
Figure 1. The colony digital-phenotyping architecture |
Alt text
A structured conceptual diagram that shows the colony digital-phenotyping architecture, with labelled components, directional relations, contextual modifiers, uncertainty points, and a clear boundary between observed evidence and proposed synthesis.
After contextualization, a conditional fusion layer tests whether signals provide complementary rather than merely correlated information. Carbon-dioxide monitoring offers an additional colony-atmosphere channel that may reflect ventilation, population, metabolism, and enclosure conditions [31]. Precision monitoring of daily honey production similarly demonstrates that weight-derived information can support operational interpretation when its measurement context is defined [32].
The final layers separate interpretation, validation, and action. A model may output a state hypothesis, uncertainty interval, competing explanations, and inspection priority. Biological adjudication then compares that hypothesis with brood condition, adult population, queen status, food stores, parasite burden, pathogen evidence, exposure history, and microbiota where justified. Only after this step should a human decision interface present management options. Early detection is not equivalent to beneficial intervention because treatment effects depend on correct causal attribution, timing, colony condition, competing risks, and implementation quality. The proposed components, evidence bases, boundary conditions, failure modes, and validation requirements are organized in Table 3.
Table 3. Proposed Digital-Phenotyping Architecture: Components, Evidence Basis, Relations, Boundary Conditions, Failure Modes, and Validation Requirements
|
Proposed component |
Purpose |
Evidence basis |
Relation or mechanism |
Input or precondition |
Expected output |
Boundary condition or failure mode |
Validation requirement |
|
Distributed sensing |
Capture colony and environmental observations |
Integrated and wireless hive systems |
Parallel acquisition across modalities |
Calibrated sensors and reliable power |
Time-stamped raw data |
Drift, placement effects, outages |
Device calibration and field-quality audit |
|
Modality-specific processing |
Preserve the meaning of each channel |
Contactless and embedded monitoring |
Separate cleaning and feature extraction |
Defined artefact rules |
Quality-qualified features |
Premature fusion obscures errors |
Channel-specific repeatability testing |
|
Context layer |
Condition signals on biological and environmental circumstances |
Weather, inspections, and hive metadata |
Adjusts interpretation for season, colony history, and management |
Complete contextual records |
Contextualized deviations |
Missing management events create false anomalies |
Prospective metadata capture |
|
Conditional fusion |
Identify complementary cross-modal evidence |
Joint sensor and forecasting studies |
Integrates compatible features without erasing modality identity |
Temporally aligned inputs |
Uncertainty-qualified state hypothesis |
Shared seasonality appears as confirmation |
Ablation, calibration, and external transfer testing |
|
Atmospheric channel |
Add information on hive ventilation and metabolism |
Carbon-dioxide monitoring |
Relates internal atmosphere to colony activity and enclosure |
Stable sensor and hive-context data |
Atmospheric trajectory |
Ventilation and hive design confound biology |
Comparison with population and ventilation observations |
|
Production and resource channel |
Interpret mass change in operational context |
Precision honey-production monitoring |
Connects weight dynamics with resource inflow and removal |
Scale stability and event logs |
Resource-related trajectory |
Water, bees, rain, and manipulation alter mass |
Independent harvest and inspection records |
|
State-inference layer |
Generate ranked explanations |
Forecasting and anomaly-detection evidence |
Maps fused features to conditional hypotheses |
Defined labels and uncertainty model |
State estimate with alternatives |
Output is treated as causal diagnosis |
Biological adjudication and prospective evaluation |
|
Human decision layer |
Support inspection and proportionate response |
Monitoring frameworks distinguish observation from action |
Presents evidence, uncertainty, and next-step options |
Defined responsibility and decision pathway |
Inspection or management recommendation |
Alert triggers unjustified treatment |
Decision audit and outcome follow-up |
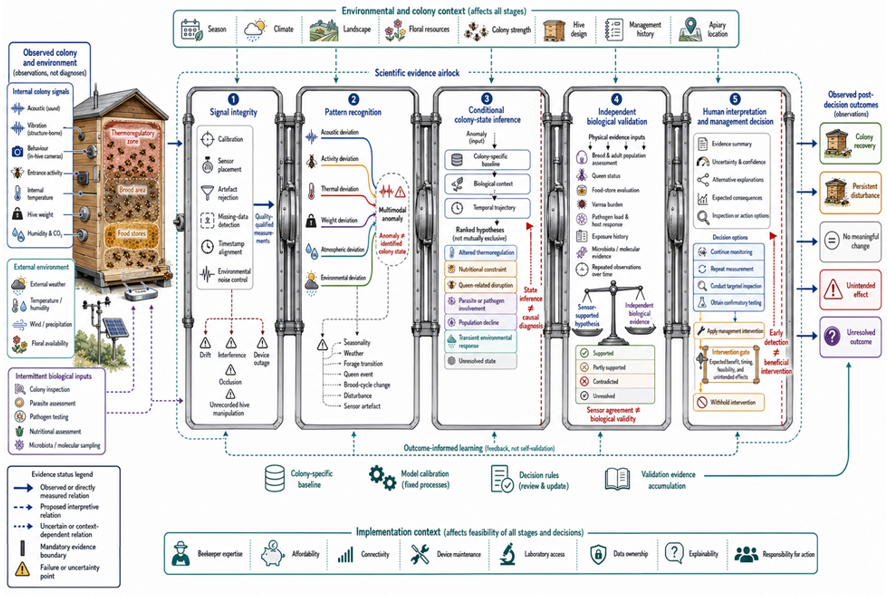
These signals should contribute to state hypotheses, not automatic diagnoses. Figure 2 demonstrates how multimodal signals could support colony-state interpretation and intervention within the analytical logic developed in this section.
|
|
|
Figure 2. Demonstrate how multimodal signals could support colony-state interpretation and intervention |
Caption
Conceptual synthesis designed to demonstrate how multimodal signals could support colony-state interpretation and intervention. Arrows and grouping indicate proposed or evidence-supported relations, not measured effect sizes or universal causal pathways. Relations must be qualified in the text with the approved references.
Validation, interpretation, and management implications
Validation must connect sensor-derived hypotheses to independent biological evidence at the appropriate scale. Metagenomic and gene-expression patterns observed in declining commercial colonies illustrate the potential value of molecular profiles for distinguishing biological states, while also showing that signatures are associations shaped by colony condition, viral communities, and sampling context [33]. Transcriptional markers associated with Varroa parasitization and colony decline similarly support mechanistic validation, but no molecular marker should be treated as universally diagnostic without temporal, population, and external validation [34]. Progress therefore requires longitudinal designs in which continuous sensing is paired with standardized inspections and biological sampling before, during, and after transitions.
Real-world pesticide exposure adds a further validation challenge because colonies encounter mixtures that vary across time and place [35]. A model trained where exposure patterns, forage systems, climate, or management practices are narrow may fail when transferred elsewhere. Required priorities include multisite testing, transparent reporting of missing data, evaluation across colony strengths and seasons, pre-specified reference standards, calibration of uncertainty, and analysis of false alerts. Safety requires that the architecture reveal alternative explanations and data limitations rather than presenting one opaque risk score.
Implementation depends on whether outputs are understandable, actionable, affordable, and compatible with beekeeping practice. Evidence on European beekeepers’ interest in digital monitoring indicates that adoption is shaped by perceived utility and management context rather than technical availability alone [36]. Decision support should therefore preserve beekeeper control, distinguish observation from recommendation, and record whether alerts led to inspection, treatment, no action, or unintended consequences.
CONCLUSION
A honey-bee colony becomes meaningfully computable only when its measurements remain connected to the biological constructs, contexts, and uncertainties they represent. Acoustic, behavioural, thermal, weight, environmental, nutritional, parasitological, pathological, and microbial information can jointly strengthen colony-state interpretation, but no signal or fused model independently establishes causal diagnosis. The proposed architecture therefore separates acquisition, modality-specific processing, contextualization, conditional fusion, state inference, biological adjudication, and management decision-making. Its strongest defensible implication is that multimodal convergence should be used to prioritize explanation and inspection, not to bypass them. Sensor agreement is not equivalent to biological validity, and earlier detection is valuable only when subsequent action is appropriately targeted, feasible, and demonstrably beneficial. The highest priority is the creation of longitudinal, externally validated, biologically anchored datasets and transparent decision pathways that preserve uncertainty, alternative explanations, beekeeper judgement, and accountability.
ACKNOWLEDGMENTS: None
CONFLICT OF INTEREST: None
FINANCIAL SUPPORT: None
ETHICS STATEMENT: None